NStars 1: photometric surveys --- | ---
NStars 3: companion searches
NStars 1: photometric surveys --- | ---
NStars 3: companion searches
 NStars 1: photometric surveys --- | ---
NStars 3: companion searches
NStars 1: photometric surveys --- | ---
NStars 3: companion searches
Main investigators: Cruz, Reid; Kilkenny (SAAO sample); Golimowski, Williams (APO).


Candidate nearby dwarfs in the NLTT: target identification
1. Identifying M dwarfs within 20 parsecs: sample 1
The NLTT catalogue gives positions for equinox 1950. Those positions were precessed to equinox 2000, and proper motion corrections applied to epoch 1998 (approximately the midpoint of the 2MASS survey, at least for the data in the second incremental release). Given those positions, we used the standard software provided by IRSA to search the second incremental release of the 2MASS catalogue (47% of the sky) for sources within 10 arcseconds of those positions. Sources with Galactic latitude |b| < 10o were excluded a priori from the search. A total of 35308 NLTT stars have no corresponding 2MASS source (from the Second Incremental release) within this search radius; 23795 NLTT stars are matched against 25305 2MASS sources - that is, approximately 6% of the NLTT stars have at least two 2MASS counterparts. This catalogue of matched sources represents is the input catalogue for the colour selection procedures described in the introduction .
Figure A2.1: The distribution of bright and faint sources on the celestial sphere. |
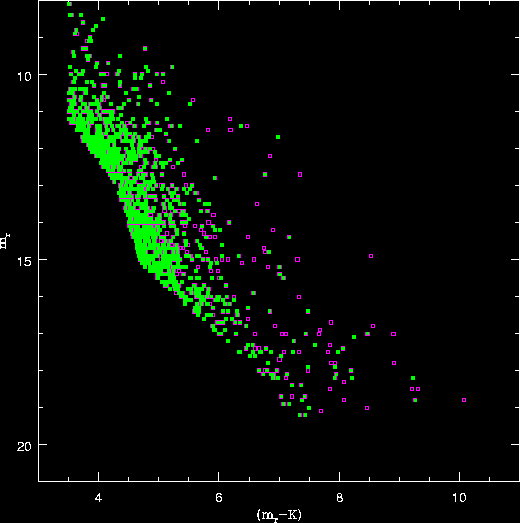
We have taken the NLTT stars with 2MASS counterparts and applied the (mr, (mr-K)) selection criteria described previously. That reduces the sample to a total of 1456 targets. Of these, 22 have crept into the sample through having null mr magnitudes; all 22 lie south of dec=-30o, and have bright photographic magnitudes and faint JHK counterparts (indicating that the positions are suspect). The remaining 1434 stars constitute our NLTT sample 1: 818 lie north of the equator; 616 lie in the south. Among the northern stars, 483 have mr < 14.0, 335 are fainter; 319 southern stars are brighter than that magnitude limit, and 297 are fainter. Figure A2.1 plots the distribution of those sources on the sky.
Figure A2.2: The colour-magnitude distribution for the NLTT sample before (purple) and after (green) excluding NLTT binary mismatches. |
Figure A2.3: The JHK and mrJK diagrams for NLTT sample 1 after removing NLTT binary mismatches. The dwarf and giant sequences (from Bessell & Brett, 1988) are plotted in the JHK plane. The green points mark 20 sources with non-dwarf-like JHK colours; most also have discrepant (mr-K) colours. |
Figure A2.4: The reduced proper motion diagram for the NLTT sample |
Figure A2.4 plots the reduced proper motion diagram for the nearby-star candidates from the NLTT. The sample includes LHS 2090, the M6.5 recently identified as being within 7 parsecs of the sun.
The stars in NLTT sample 1 have magnitudes between 9th and 18th magnitude in mr. If we are successful in identifying nearby stars, we can expect at least the brightest of those sources to have previous observations, and perhaps well determined trigonometric parallaxes. We have cross-referenced our target list against several published catalogues:
2.1 The Hipparcos catalogue: Cross-referencing the NLTT sample against the Hipparcos astrometric catalogue gives a total of 236 positional matches within a search radius of 10 arcseconds, 144 in the northern sample and 92 from the southern hemisphere. These include a number of matches between 2MASS data for a secondary and Hipparcos data for the primary; the Hipparcos astrometry remains valid in those cases.
2.2 The pCNS3 catalogue: Many of the stars in this sample are known nearby stars, catalogued in the pCNS3. We cross-referenced the 2MASS NLTT dataset against the pCNS3 catalogue, taking the positions from that source and applying precession and proper motion corrections to give equinox and epoch 2000 positions. We find a total of 411 positional matches within 10 arcseconds, 287 in the north and 124 south of the equator; expanding the search radius to 60 arcseconds picks out a further 40 pCNS3 stars, for a total of 451. In the listing, NCNS3 is the (unofficial) order number from the original pCNS3 listing; TiO5 and CaH2 are bandstrength measurements from the PMSU survey.
2.3 LHS stars: Cross-referencing against the machine-readable version of Luyten's LHS catalogue gives 240 matches in the northern sample and 145 in the southern sample. Weis has measured (B)VRI magnitudes for 1194 LHS stars, including 140 in our northern sample and 55 in the southern sample. We have converted his Kron photometry to Cousins RI data.
2.4 Weis' photometric observations of NLTT stars: Weis has also obtained VRI photometry for 1929 NLTT stars classed as spectral type m and with positive declination. Cross-referencing that sample against our sample gives 120 matches, again including a number of double stars, where both 2MASS detections are matched against optical photometry of the primary.
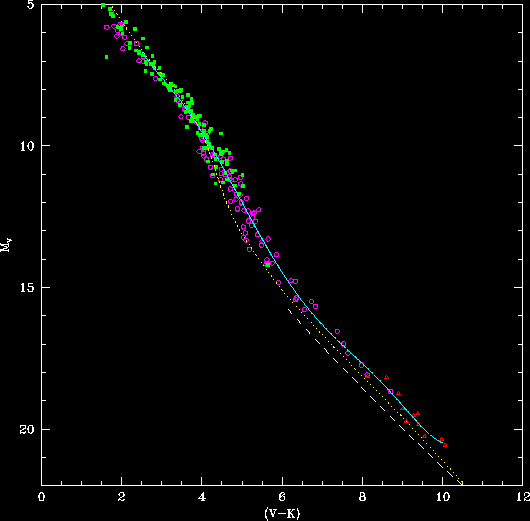
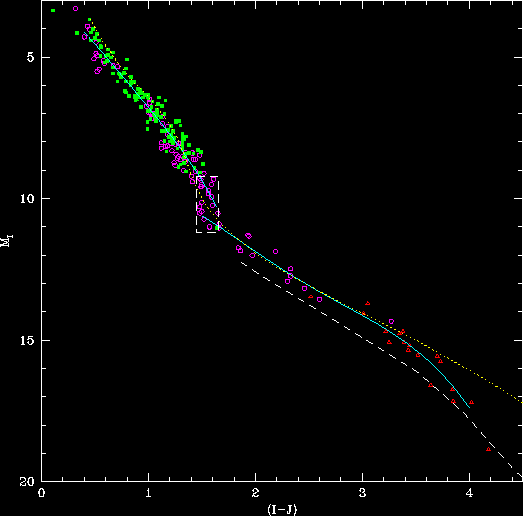
Trigonometric parallaxes are available for only a subset of the stars included in other catalogues, and, obviously, for none of the remaining, previously unobserved stars in NLTT sample 1. As a result, we have to resort to photometric and, in come cases, spectroscopic parallax measurements to estimate distances. While these measurements are less accurate, they allow us narrow down the sample, excluding stars which are extremely unlikely to be within 20 parsecs. We have used data for stars with accurate parallax measurements (< 10%) to define colour-magnitude relations for three colours: (V-K), (V-I) and (I-J).
Figure A2.5: (MV, (V-K)) calibration adopted for our analysis. Green points plot data for nearby stars with Hipparcos parallax measurements, magenta points are stars in the 8-parsec sample, and red points are from Dahn et al (2001). All known binaries have been excluded from the calibrating sample, and the trigonometric parallax measurements all are accurate to better than 7 %. The blue line marks the best-fit polynomial; the yellow dotted line plots the 5-Gyr, solar-abundance isochrone from Baraffe et al (1998); the dashed line plots the 5-Gyr DUSTY models from Chabrier et al (2000). |
The mean (V-K) calibration is
Figure A2.6: (MV, (V-I)) calibration adopted for our analysis. Symbols have the same meaning as in Figure A2.5. |
The mean (V-I) calibration is given in three segments, taking account of the significant change in slope at (V-I) ~ 2.9 (spectral types M3/M4). This feature is discussed in more detail by Reid & Gizis (1997), Clemens et al. (1998) and in Paper 1. The relations are:
Figure A2.7: (MI, (I-J)) calibration adopted for our analysis. Symbols have the same meaning as in Figure A2.5. Note the striking discontinuity at (I-J)~1.6 (~M3/M4). |
The (MI, (I-J)) relation also has a significant discontinuity at spectral type M3/M4, where the sequence is essentially vertical. Rather than fit a relation in this region, we simply assign a magnitude of MI = 10.2 +/- 0.7 for stars with 1.45 < (I-J) < 1.65. The upper main-sequence is represented by
Besides plotting the mean empirical relations, Figures A2.5 to A2.7 also show model predictions from Naraffe et al (1998 - solar abundance models, 5 Gyr. isochrones) and the Chabrier et al (2000) DUSTY models for low-mass (<0.1 Msun) stars and brown dwarfs (also solar abundance and 5 Gyrs age). In general, the former models are a better fit at optical wavelengths, while the latter provide a better match at redder colours in the (I-J) plane (and in (J-K) - not shown here).
We have derived formal distance estimates to stars in NLTT sample 1 by combining the
photometric parallaxes, weighted by the observed dispersion for each relation, to give a mean
photomewtric parallax, and then averaging that estimate with trigonometric data, should such
be available. Note that there is a difference, in principle, between photometric (and
spectroscopic) parallax measurements
photometric (and spectroscopic) parallaxes give an estimate of the average absolute magnitude
corresponding to a given colour (or bandstrength);
trigonometric parallaxes estimate the distance to an individual star.
The net result is that photometric parallaxes do not take into account intrinsic variations
between stars (due to binarity, abundance variations, age, etc.). In principle, the
trigonometric measurement offers the best estimate of the distance to an individual star;
in practice, many of the stars with trigonometric data in NLTT sample 1 have low accuracy
measurements. To minimise bias in the mean magnitude derived for those stars, we set a
lower limit of 0.3
magnitudes on the uncertainty associated with the mean photometric parallax. That weight carries
through to the averaging with the trigonometric data, so accurate trig. parallaxes dominate the
final solution.
Full results for the previously-observed stars in NLTT sample 1, together with more details of the analysis and ascii versions of the tables, are given in Paper 1 (Reid & Cruz, 2002: see our list of publications.
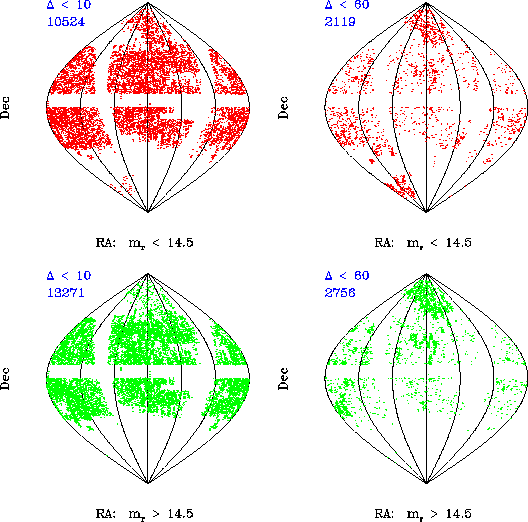
We noted in the introductory section that it is well known that some stars in the NLTT catalogue have inaccurate positions. Matching up those stars against the 2MASS database is clearly a more problematic operation. We have tackled this problem by eliminating the 23795 NLTT stars with a 2MASS source within 10 acseconds, and re-matching the 38305 remaining stars in the NLTT catalogue against the 2MASS second incremental release, but this time with a search radius of 60 arcseconds. An additional 5728 sources have at least one 2MASS counterpart; 4875 lie outwith the |b| < 10o
Figure A2.8: The distribution on the celestial sphere of NLTT stars with a 2MASS counterpart within 10 arcseconds (left panels) and with no near (<10 arcsec) counterpart, but a source within 60 arcseconds (right panels). The distribution is clearly not random in (RA, dec). |
Figure A2.8 plots the celestial distribution of the two NLTT/2MASS paired samples - the 23795 NLTT stars with counterparts within 10 arsceconds (the near sample) and the 4975 stars in the wide sample. The large-scale features evident in both plots (no stars with 0 < dec < 10o; few stars south of -30o, for example) are due either to the distribution of stars in with 2MASS Second Incremental release, or our exclusion of the Galactic Plane. However, other features are not, notably the paucity of faint stars near the South Galactic Pole (0 hours, -30 degrees) and North celestial Pole in the near sample, and the corresponding excess in the wide sample. This clearly reflects systematic errors in the positions of the NLTT stars in those regions. Around the NCP, this is not too surprising, since the plate geometry could quite easily lead to systematic offsets; for the SGP, Luyten conducted a separate analysis, extending to lower proper motion limits, and it is possible that the NLTT data are taken from that source. There is also a suggestion of a systematic pattern of mismatching near the NGP.
The systematics evident in Figure A2.8 suggest strongly that a number of real NLTT/2MASS matches lie buried in the wide sample. We have applied the same colour-magnitude selection criteria to that sample as applied to the near sample.
Figure A2.9: The JHK and mrJK diagrams for the 1468 sources surviving (mr, (mr-K)) selection. The green points mark 514 sources lying within M-dwarf/L-dwarf boundaries in the JHK plane. |
Note: the positional uncertainties inherent in the NLTT catalogue mean that it is entirely possible
that some of the NLTT sources in the 23795-star parent sample for NLTT sample 1 are matched
against 2MASS data for field stars, rather than the actual counterpart. Short of checking each source
individually for evidence for proper motion, there is little we can do to correct these mismatches
at present. Given the overall source density, such random mismatches are likely to be fairly rare.
Rather than trying to complete the NLTT sample, the more effective approach is to construct a new
proper motion catalogue from scans of the multi-epoch POSS I/II and UKST photographic surveys(e.g. USNO B),
with more accurate positions, motions and optical photometry. Matching that sample against 2MASS will
circumvent the many irregularities associated with the NLTT.
For the present, the NLTT provides a means of identifying previously unrecognised Solar Neighbourhood stars,
bearing in mind the caveat that there are no guarantees as to the completeness of the resulting sample.
Work in progress.
During the course of our study, an independent re-investigation of the NLTT catalogue
was undertaken by Salim & Gould (2002a, b, c). Part of that study involved checking Luyten's catalogue
for obvious typographical errors (switched digits, co-ordinates offset by 10 arcminutes, etc.) and,
as a result, the initial search list of co-ordinates is more accurate that in our NLTT analysis.
Salim and Gould have cross-referenced their sample against the 2MASS second incremental database,
giving ther following catalogue:
Work in progress.
Follow=up observations of stars in all three of these samples are/will be described on the following pages:
 NStars proper motion star index
NStars home page
INR home page