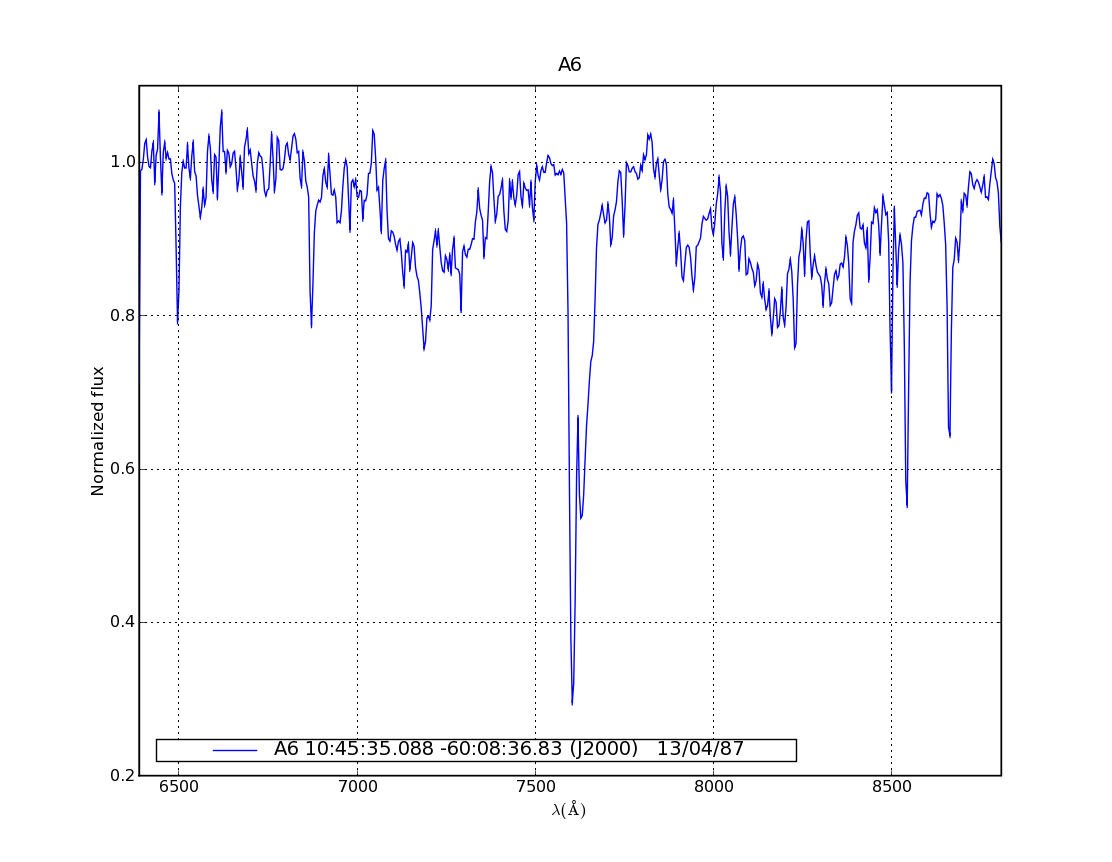
Sample normalized spectrum of the new supergiant star BN Car, K3Iab, in the &lambdaλ6400 - 8800 region.
These spectra were taken in conjunction with a survey program based on near-infrared, objective-prism plates with the goal of discovering red supergiant stars (RSGs) along the southern galactic plane. This approach was based on papers of Jason Nassau, Victor Blanco, and William Morgan (1954ApJ...120..478N) and of Blanco and Luis Münch (1955BOTT....2l..17B) which led to the discovery of several dozen bright M supergiants along the northern and southern Milky Way. More have been found in the intervening decades and recently Figer et al. (2006ApJ...643.1166F) reported 14 in a massive young cluster at 5.6 Kpc, Davies, et al. (2007ApJ...671..781D) found a cluster dominated by 26 RSGs at the base of the Scutum-Crux arm only a few hundred pc from the Figer et. al cluster, and Clark et al. (2009A&A...498..109C) reported 16 more in a third massive cluster in the same general direction as the first two. A search of the SIMBAD database for galactic M stars of luminosity class Ib/Ib: and brighter yields about 160.
The present general field survey, based on objective-prism plates taken with the Curtis Schmidt telescope at CTIO, has been described in detail in MacConnell, Wing, and Costa (1992AJ....104..821M); an example of a typical plate is given below. As with the earlier works cited, unwidened near-ir (&lambdaλ6800 - 8800) plates of low dispersion (3500 Å/mm at the telluric A-band; plate scale 96.6"/mm) were scanned visually (by DJM) for stars showing a tapered appearance, the signature of stars suffering significant interstellar extinction over long path lengths. More than 4,000 candidates were marked, about 15% independently on two or more overlapping plates, over the area of the plates surveyed, roughly 208° < l < 352° and within 7° of the galactic plane. The depth and quality of the plates, taken over many seasons, vary somewhat, the deepest reaching mi ~13, but the faintest candidates are usually about one mag brighter since both ends of the spectrum must be visible to detect the tapered shape. Stars marked as candidate supergiants must be confirmed via classification on the MK system by narrow-band photometry and/or by slit spectra comparing them to standard stars that define the system. This is because, at this low dispersion, stars of tapered shape can turn out to be S stars, late M giants, reddened early-to-mid supergiants, or the sought-after RSGs. Of the 1572 candidates observed by one or both methods, 1464 were observed in the Wing eight-color system (1971CoKit.554..145W) at CTIO on more than 20 runs, and 830 had slit spectra taken at one or more of three observatories: CTIO, La Silla, and Las Campanas. The wavelength region of &lambdaλ6400 - 8800 was chosen to include the λ6474 band of ZrO, peculiar to S-type stars which can be confused with reddened supergiant candidates on the plates and in the eight-color photometry, and the luminosity-sensitive Ca II lines at &lambdaλ8498, 8542 and 8662. The eight-color observations will be discussed elsewhere, and here we present the slit spectra.
A graphic showing the galactic distribution of all program stars observed is here. Due to the vagaries of scheduling and weather, the distribution is not uniform; the best uniformity of coverage is 210° < l < 250° and 285° < l < 340°.

As mentioned, the observations were performed at three observatories in Chile using four telescopes, and Table 1 gives an overview of the telescopes and spectrographic parameters employed. A slit width of 2" was common to all runs.
The figure below shows three M0 standards of different luminosity taken at CTIO at the lower dispersion. Note the luminosity-sensitive features at 6497 Å (a blend of Ba II, Fe I, Ca I, Mn I, etc.) and the broad CN absorption in the 7950 Å region. The Ca II triplet on the right is also sensitive to luminosity.

| U. T. Date | Observ. | Telescope | Spectrograph | Grating/Blaze | CCD | Resol. |
|---|---|---|---|---|---|---|
| 1985/03/01-04 | CTIO | Yale 1m R-C f/10 | Boller & Chivens | 300 l/mm; 7500 Å | GEC; 22μ pix. | 3.0 Å |
| 1985/11/25-27 | dto. | CTIO 1.5m R-C f/7.5 | dto. | 300 l/mm; 6750 Å | dto. | 4.5 Å |
| 1986/02/26-/03/01 | dto. | dto. | dto. | dto. | dto. | dto. |
| 1986/03/02 | dto. | dto. | dto. | 831 l/mm; 8000 Å. | dto. | 1.6 Å |
| 1987/04/13-16 | dto. | dto. | dto. | 300 l/mm; 6750 Å | dto. | 4.5 Å |
| 1989/01/31-/02/01 | dto. | dto. | dto. | dto. | dto. | dto. |
| 1992/05/15-19 | dto. | dto. | dto. | dto. | dto. | dto. |
| 1988/12/27-31 | LCO | du Pont 2.5m f/7.5 | "Modular" | 600 l/mm; 7500 Å | TI; 15μ pix. | 4.2 Å |
| 1992/07/12-16 | La Silla | ESO 1.52m f/14.9 | Boller & Chivens | 600 l/mm; 9100 Å | Ford; 15μ pix. | 4.5 Å |
| 1992/08/11-12 | dto. | dto. | dto. | dto. | dto. | dto. |
| 1994/03/30-/04/02 | dto. | dto. | dto. | dto. | dto. | dto. |
The standard IRAF procedures were followed for the reduction of spectra taken at the three observatories. Sufficient bias frame, dome flat field, and wavelength calibration lamp exposures were taken each night to ensure reliable reductions. The ccdred package was used to subtract the overscan bias, subtract an average dark frame, and divide all object spectra by an average flat-field frame. The spectra were then extracted using the IRAF task apall. Flux standard stars were observed but not used since spectra of the program stars are usually reddened and had to be normalized to unity for comparison with the typically unreddened MK standards. For the normalization, four near-continuum points were chosen (about 6530, 7040, 7560, and 8780Å), and a Legendre polynomial of order 3 was passed through them. Finally, all spectra were wavelength calibrated with the He-Ar lamp spectra taken each night.
The IRAF native .pix and .imh files were converted to FITS format with the wfits utility. A special Python program was written to convert the FITS files into the PNG format and present information from the FITS header (MacConnell, Patterson, Wing, Costa, and Jedrzjewski, 2008AAS...212.2409M) for display on the Web. The program may be accessed here.
The RA_J2000-ordered Excel® spreadsheet of the program stars observed spectroscopically is here. In the table one can view the individual spectra, download one at a time in the FITS format, or download a zipped file of all. The star name in the left column is an internal one based on the plate field (alphabetic part) and a running number on the plate. Columns I(104) and Theta give the magnitude at the 1.04μ continuum point and the inverse color temperature 5040/T from the Wing 8-color photometry, respectively. The final column gives the date the spectrum was taken and the spectral type assigned by DJM.