Proposal 5745 was a calibration test designed to map out the central portion of the PSF as presented to the GHRS apertures by COSTAR. This particular test made use of a spatial scan to map out the PSF while collecting data in RAPID mode.
------------------------------------------------------------------------------------------------------------------------------------
EXPOSURE LOGSHEET ID = 5745 [ 4]
------------------------------------------------------------------------------------------------------------------------------------
1 | 2 | 3 | 4 | 5 | 6 | 7 | 8 | 9 |10 | 11 | 12 |13 |14| 15
------------------------------------------------------------------------------------------------------------------------------------
Line | Seq | Target |Instr | Oper. | Aper |Spectral|Central| Optional |Num| Time | S/N |Flx|Pr| Special
Number | Name | Name |Config| Mode |or FOV |Element |Waveln.| Parameters |Exp| |Rel. Time|Ref| | Requirements
------------------------------------------------------------------------------------------------------------------------------------
10 SK-65D21 HRS ACQ 2.0 MIRROR-N1 SEARCH-SIZE=5 1 25S 1 ONBOARD ACQ FOR 15
BRIGHT=RETURN -20
CYCLE 4 / 10-40
Comments: STEPTIME=1.0S EXPECT APPROX.
2800 COUNTS/S TARGET IS IN CVZ
------------------------------------------------------------------------------------------------------------------------------------
15 SK-65D21 HRS IMAGE 2.0 MIRROR-N1 NX=16 1 256S 1
NY=16
DELTA-X=4
DELTA-Y=4
Comments: STEPTIME=1.0S
------------------------------------------------------------------------------------------------------------------------------------
20 SK-65D21 HRS ACQ/ 0.25 MIRROR-N1 SEARCH-SIZE=5 1 25S 1 ONBOARD ACQ FOR 25
PEAKUP
Comments: STEPTIME=1.0S
------------------------------------------------------------------------------------------------------------------------------------
25 SK-65D21 HRS ACQ/ 0.25 MIRROR-N1 SEARCH-SIZE=5 1 25S 1 ONBOARD ACQ FOR 40
PEAKUP
Comments: STEPTIME=1.0S
------------------------------------------------------------------------------------------------------------------------------------
40 SK-65D21 HRS RAPID 0.25 G140L 1400 SAMPLE-TIME=1.0 1 112.5M 1 SPATIAL SCAN
SINGLE-EXP
Comments: 15X15 GRID WITH 0.053 ARC SEC
SPACING EXPTIME AT EACH DWELL
POINT=30S
------------------------------------------------------------------------------------------------------------------------------------
Scan Paramters Form Proposal ID: 5745 [ 5]
------------------------------------------------------------------------------------------------------------------------------------
Data ID: 1
Exposure Logsheet lines: 40
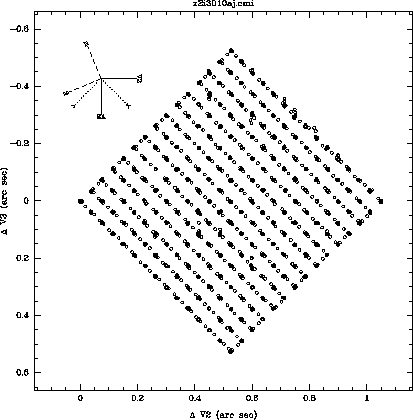
FGS Scan: DWELL Dwell Only: dwell points/line: 15 Seconds per dwell: 30.00
Scan width (arc-secs): 0.7420 Scan length (arc-secs): 0.7420 Angle between sides (degrees) 270.00
Number of lines: 15 Scan rate (arc-sec/sec): 0.0000 PA of first scan line (degrees) 90.000
Scan frame (CEL or S/C): S/C Length Offset (arc-sec): 0.3710 Width Offset (arc-sec): 0.3710
cl> imhead ../data/z2i3010at.d0h,../data/z2i3010at.c1h l-The imheader task shows that we have many more spectra than expected. Further investigation turned up the fact that ten seconds was allocated for the slew from dwell point to dwell point. So we ended up having an extra ten seconds for each slew. Not all of these extra spectra are useful since the telescope was actually moving, but we ended up getting about 35 seconds per dwell point instead of the anticipated 30 seconds. The imheader output also shows that there are three less spectra in the calibrated output than in the raw data. Keep in mind that since there is no substepping or FP-SPLITs possible when using RAPID mode, that a single raw spectrum maps to a single calibrated spectrum. (Contrast this with a standard ACCUM with the default STEP-PATT: the raw data would contain six individual spectra-four substeps and two background spectra-which would be merged into a single calibrated spectrum.) In the case of RAPID mode, the first two readouts were generated during a hysteresis sequence that preceded every observation, and the last readout was produced by a final pass deflection made at the end of every observation. These readouts contain no useful science data and are not included in the calibrated data.
../data/z2i3010at.d0h[1/9024][500][real]: Z2I3010AT[1/9024]
../data/z2i3010at.c1h[1/9021][500][real]: Z2I3010AT[1/9021]
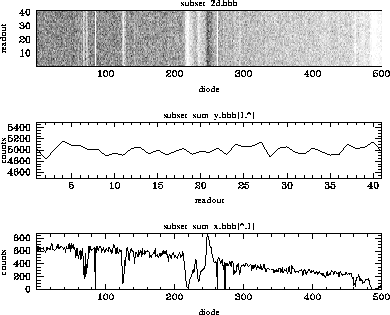
Manipulating a very large image can be difficult. For demonstration purposes, let's examine an arbitrary subsection of the original raw image in Figure 35.20. The gcopy task was used to extract a subset of groups from the original multi-group image. gstat computed the statistics for the new image.
cl> gftoxdim subset.hhh subset_d2.hhhThe new image is now two-dimensional: the first dimension runs from diode 1 to 500 while the second dimension marks time.
cl> imhead subset_d2.hhh l-

subset_2d.hhh[500,41][real]: SUBSET_2D[1/1]

cl> display subset_d2.hhh 1 z1=0 z2=40 zr- zs-
cl> gcopy ../data/z2i3010at.d0h subset.hhh groups=4604-4644
../data/z2i3010at.d0h -> subset.hhh
cl> gstat subset.hhh groups=*
# Image Statistics for subset.hhh
# GROUP NPIX MEAN MIDPT STDDEV MIN MAX
1 500 10.048 9.00849 5.7949 0. 28.
2 500 9.68 9.87606 5.31584 0. 24.
3 500 10. 9.12097 5.48161 0. 27.
4 500 10.334 9.88548 5.68217 0. 27.
5 500 10.174 9.94917 5.75412 0. 28.
6 500 10.166 9.00516 5.83254 0. 28.
7 500 10.014 9.06106 5.56919 0. 25.
8 500 10.04 9.8603 5.64465 0. 29.
9 500 9.792 9.00807 5.29384 0. 28.
10 500 9.886 9.92473 5.40587 0. 26.
11 500 9.818 8.99274 5.39881 0. 28.
12 500 10.072 9.82091 5.79603 0. 27.
13 500 10.092 9.89125 5.59913 0. 25.
14 500 9.856 9.10092 5.50562 0. 29.
15 500 10.004 9.05718 5.64195 0. 29.
16 500 9.822 9.01055 5.71381 0. 35.
17 500 9.952 9.88586 5.57313 0. 24.
18 500 10.054 9.94277 5.68822 0. 30.
19 500 9.856 9.01978 5.35805 0. 25.
20 500 9.958 8.97168 5.75312 0. 28.
21 500 9.916 8.98258 5.69824 0. 26.
22 500 10.07 9.86902 5.49741 0. 23.
23 500 9.834 9.90083 5.55231 0. 25.
24 500 10.206 9.83871 5.75446 0. 32.
25 500 10.122 9.00645 5.72859 0. 28.
26 500 10.148 10.128 5.65137 0. 31.
27 500 10.286 10.0233 5.7052 0. 28.
28 500 9.76 9.03122 5.41859 0. 25.
29 500 10.068 9.04799 5.69493 0. 25.
30 500 10.12 10.0108 5.52473 0. 28.
31 500 9.908 8.98854 5.53071 0. 26.
32 500 9.856 9.09568 5.40905 0. 29.
33 500 10.076 9.90533 5.61045 0. 25.
34 500 9.942 9.84996 5.42379 0. 27.
35 500 9.822 9.88937 5.39598 0. 25.
36 500 9.832 9.87903 5.58553 0. 25.
37 500 10.206 9.8606 5.54952 0. 27.
38 500 10.05 9.8626 5.61128 0. 26.
39 500 10.102 9.97581 5.49509 0. 25.
40 500 10.304 9.91161 5.80646 0. 27.
41 500 9.926 8.99917 5.49809 0. 32.
We can sum the two-dimensional image in each dimension for further -inspection:
cl> blkavg subset_2d.hhh subset_sum_y.hhh b1=1 b2=41 option=sumFigure 35.21 shows plots of three images. At the top is a greyscale plot of the extracted two-dimensional image, in the middle is a plot of the sum of the 500 diodes as a function of time, and at the bottom is a summed plot of the spectra over time.
cl> blkavg subset_2d.hhh subset_sum_x.hhh b1=500 b2=1 option=sum
cl> imhead subset_sum_?.hhh l-
subset_sum_x.hhh[500,1][real]: SUBSET_SUM_X[1/1]
subset_sum_y.hhh[1,41][real]: SUBSET_SUM_Y[1/1]
Figure 35.21: RAPID Data Displays