|
| WFPC2 Instrument Handbook for Cycle 10 | |||
|
|
Photometric Anomalies: CTE and Long vs. Short
There are two photometric anomalies which have now been extensively characterized. Both are related to nonlinearities in the CCD detectors. The first is due to the imperfect charge transfer efficiency (CTE) of the detectors, which causes sources at high row and column numbers to appear fainter than otherwise because the charge is transferred over a bigger fraction of the chip. This anomaly is increasing with time, especially for faint sources, presumably as a consequence of on-orbit radiation damage. The second, called "long vs. short", causes sources to have a lower count rate - and thus appear fainter - in short exposures than in longer exposures, and appears independent of the position on the chip. The physical cause of the long vs. short anomaly is not fully understood, and it does not appear to change with time. We have developed correction formulae which appear to reduce the impact of both anomalies to about 2-3% for faint sources. These are fully described below.
Charge Transfer Efficiency
The WFPC2 CCDs have a small but significant charge transfer efficiency (CTE) problem which causes some signal to be lost when charge is transferred down the chip during readout. This has the effect of making objects at higher row numbers (more charge transfers) appear fainter than they would if they were at low row numbers. The effect depends on the temperature of the CCDs. At the original temperature of -76°C, as much as 10-15% of the light within a 0.5" radius aperture around a bright star could be lost for objects at the highest rows. As a result, the CCD operating temperature was changed to -88°C on 23 April, 1994. This reduced the effect to a maximum amplitude of 4% for stars with more than 1,500 total detected electrons. This ~4% amplitude seems to remain in effect for stars up to 20,000 total electrons. However, for fainter stars (few electrons) seen against a low background, the effect appears to have grown much larger (up to tens of percent) over the last 5 years. We also note that the effect depends on the amount of background light on the chip. There is significantly less CTE effect in the presence of even a moderate (several hundred electrons) background. Hence, the effect is not well described by either a constant fractional loss or a constant additive loss per charge transfer, but must be calculated as a function of target counts, background light, and epoch.
Our basic understanding is that CTE problems are caused by electron traps in the CCD's silicon. During the read out process these traps capture charge from the image electron packets as they are clocked across the CCD towards the readout amplifier. After some time delay the charge is released from the traps, but by that time the affected electron packet has moved away, so the re-deposition occurs at some distance from the electron's original position in the image. Hence this has the effect of producing "tails" on images. We believe that larger electron packets fill a larger volume in the bulk silicon, hence brighter images are able to access larger numbers of traps than faint ones. This simple paradigm also suggests that images with high background levels will tend to have less CTE problems, since the background will fill some of the traps, and prevent them from robbing charge as the CCD is read out.
CTE: photometric effects
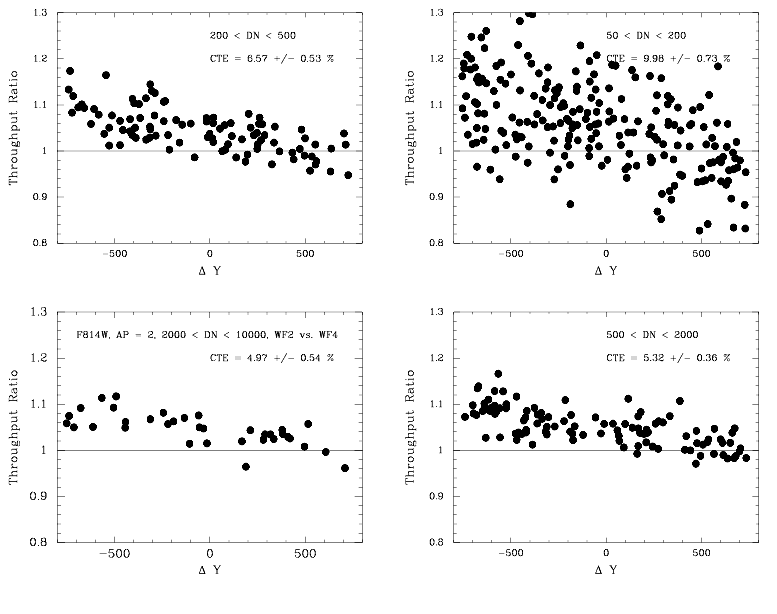
The primary observational consequence of CTE loss is that a point source at the top of the chip (Y=800) appears to be fainter than if observed at the bottom of the chip (Y=1), due to loss of electrons as the star is read out down the chip (see Figure 4.13). This is called Y-CTE. There also appears to be a similar, but weaker tendency, for stars on the right side of the chip (X=800) to be fainter (called X-CTE). The effects also depend on the brightness of the star and the background level.
The photometric calibration of the instrument presented in this Handbook is based on Holtzman, et al. (1995b). It has been corrected for CTE by assuming a 4% loss across the 800 rows of the CCD (i.e. 2% correction for CCD centers). All of the frames considered in the primary photometric calibration are short exposures of bright stars. While new correction formulae have now been developed, as discussed below, the 4% ramp is still a reasonable approximation. Hence, for data taken at -88°C, a 4% correction ramp was applied to the measured 0.5" radius aperture photometry, in the sense that objects at row 800 were made brighter by 4%, but the brightness of objects at the first row was not changed. The correction was applied to bring measurements to the values they would have had in the absence of CTE, or equivalently, the values they would have had if measurements had been made at row 0.
During the past few years, several studies were completed on the photometric effects of the Charge Transfer Efficiency (CTE) problem for WFPC2. This work was based on analysis of observations of the globular cluster
Figure 4.13: Ratio of count rates observed for the same star (i.e., Throughput Ratio) as a function of the change in row position for stars in 4 different brightness ranges. The negative slope shows that a star appears brighter when it is at low row number, thus closer to the "bottom" of the chip and the readout amplifiers, than when it is at high row number. The effect is larger for fainter stars (top right panel) as compared to bright stars (bottom left panel). See Whitmore and Heyer (1997) for details.Cen (NGC 5139). The first study provides a set of formulae that can be used to correct for CTE loss when doing aperture photometry, based on a data set taken on June 29, 1996 (Whitmore and Heyer 1997, ISR WFPC2 97-08), reducing the observational scatter in these test data from 4-7% to 2-3%, depending on the filter. The second study found evidence that CTE loss for faint stars has increased with time (Whitmore, 1998).
A continuation of this analysis using new observations of
It should be noted that CTE loss is strongly dependent on the background level in an image. Figure 4.14 illustrates CTE losses for background levels ranging from 0.03 to 70 DN/pixel. For example, for faint targets (20 - 50 DN, top left panel) a low background of 0.03 DN/pixel results in ~40% CTE loss at late epochs, while a 14 DN/pixel background produces ~4% loss. The results in the previous Figure 4.13 are based on very short (14s) exposures with very low background. By comparison, a typical WFPC2 exposure (300s in F555W) has ~3 DN/pixel background. Hence, the sky background will significantly reduce CTE loss for most science observations. CTE will primarily affect images in the UV and in narrow band filters, where the background is very low.
Figure 4.14: Y-CTE loss in stellar photometry as a function of epoch and background light. Each panel corresponds to a different range of target count levels (1 DN = 14 electrons). Different symbols correspond to different background levels; the larger plotting symbols indicate images with larger backgrounds. The straight lines represent the best-fit multilinear regression for Y-CTE as function of time, log counts (DN), and log background. See Whitmore et al. (1999).
An approximate correction for stellar photometry is given by Whitmore, Heyer, and Casertano (1999) as follows for stellar photometry performed with a 2 pixel radius aperture. For
and
they give
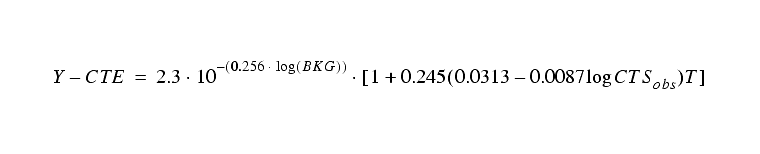

and finally the corrected stellar counts are given by
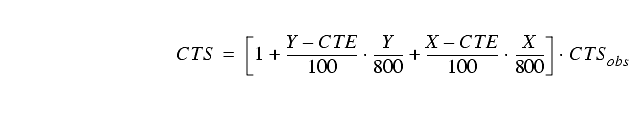
where parameters are defined as:
= number of counts (DN) measured for the star.
= percent loss over 800 pixels in Y-direction
= percent loss over 800 pixels in X-direction
= X position of star in pixels
= Y position of star in pixels
= mean background counts in image (DN)
Please see their original paper for further details.
Physical effects of CTE
Late in 1999 efforts were made to better understand the detailed effects of CTE during the read out process (Biretta, Baggett, and Riess 2000). Figure 4.15 illustrates the impact of CTE on a single pixel during the read out process. This image is the average of 700 hot pixels taken from WFPC2 dark frames from late 1999, and it effectively shows the system response to a single bright pixel at the center of a CCD. The CTE problem displaces counts into obvious "tails" extending in both the X and Y directions on the CCD. Three components of CTE can be discerned and characterized by the time delay for trapped charge to be released:
- A rapidly decaying tail in the Y direction with a decay scale of a few pixels (decay time 10s of milliseconds)
- A rapidly decaying tail in the X direction (decay time 10s of microseconds)
- An extended tail in the Y direction which decays slowly over dozens of pixels (decay time 100s of milliseconds).
All of these components have the effect of robbing charge from typical small apertures (few pixel radius) used for stellar photometry. (A fourth component of CTE is responsible for long-lived residual images, and will be discussed later.)
The brightness profile along the Y-CTE tail is shown quantitatively in Figure 4.16. While the count levels in the extended tail are low, they still make up approximately 2/3 of the total counts displaced from the hot pixel. Figure 4.16 also illustrates the effect in 1994, and gives a clear indication of the time evolution. Similar measurements made on hot pixels in separate intensity ranges are illustrated in Figure 4.17; the total charge in the Y-CTE tail (in this case for late 1999 and background level ~1 DN) is approximately

where I is the hot pixel intensity in DN at gain 7 e-/DN. This relationship together with Figure 4.16 and model PSFs can be used to predict stellar CTE, and the results appear to be in fair agreement with observations.
Cosmic rays in images are also impacted by CTE, and provide another useful probe of CTE effects. Much like the hotpixels, CTE causes tails to appear on the cosmic rays. Though cosmic rays themselves have complex shapes, these tails are still manifest as a statistical asymmetry, and this asymmetry can be used as a quantitative measure of CTE (Riess, Biretta, and Casertano 1999).
The total counts in these cosmic ray "tails" is a useful metric of CTE. As shown in the top panel of Figure 4.18, no significant tail is apparent at low Y. But at high Y an exponentially declining tail is readily apparent with an e-fold decay of 2 pixels (indicating that charge is released on the 10's of milliseconds timescale). This Y dependence closely mimics that seen in stellar photometry. These tails are very similar to those seen for hot pixels.
Figure 4.19 displays the temporal dependence of both parallel-read (Y) and serial-read (X) induced-tails for WFPC2 as measured with cosmic rays. This figure shows results from thousands of WFPC2 dark frames, and sharply delineates the degradation of CTE with time. There is even evidence for mild acceleration in the sense that the counts in the CR tails at late epochs are somewhat higher than expected by a linear extrapolation of the early data. The same growth trend is seen in Figure 4.19 for X-CTE tails except the X-tails are much weaker and have presently converged at 1/3 the size of the Y-tails. This is in good agreement with the relative strengths of X to Y stellar CTE measurements (Whitmore, Heyer, & Casertano 1999).We note that using internal data, such as these cosmic rays in dark frames, saves external HST pointed time and provides a better time sampling, compared to more conventional stellar CTE monitoring.
As mentioned above, a fourth component of CTE is manifest as long-lived residual images. These residual images are seen as faint ghost images in exposures following a highly exposed target, and tend to decay with a timescale of roughly 10 to 20 minutes (Biretta and Mutchler 1997; Baggett and Biretta 2000). They usually appear at both the location of the bright target, and in pixels below the target (smaller Y values than target). Figure 4.20 illustrates this phenomenon. The trail below the target is caused by charge which is trapped during read-out of the highly exposed image, which is then slowly released during subsequent exposures. The effect is most pronounced when long exposures in low throughput filters (narrow band or UV filters) immediately follow a highly exposed image (usually a broad band filter). These long-lived residual images may be related to surface traps on the CCD, whereas the other components are more likely related to traps in the bulk silicon.
Recent investigations reveal that CTE losses to extended sources are not uniform across the source (Riess 2000). Rather, they are proportionally greater on the side of the source which is closer to the read amplifier (i.e., low-Y), decrease in the direction away from the amplifier, and charge is regained at the opposite side (i.e., high-Y) of a source. The portion of an extended source which is far from the amplifier suffers little charge loss because charge traps encountered have been filled and in addition, charge is deferred. Our knowledge of how CTE affects galaxies and other extended sources is still growing and it is difficult at this point to provide a recipe to restore changes to the shape of a source. Nevertheless, we suggest that users consider that the total CTE loss expected for an extended source (Baggett et al. 2000; Whitmore, Heyer, & Casertano 1999) likely applies only to the side of the source near the amplifier (i.e., low-Y), with the opposite side (i.e., high-Y) facing smaller losses.
Figure 4.15: Average of 700 hot pixels illustrating the CTE effect. Data were taken from dark frames in late 1999 in all four CCDs in region 50<Y<750 and for hot pixels intensities in the range 100 to 4000 DN. The bottom panel is the same image enhanced to illustrate faint pixels.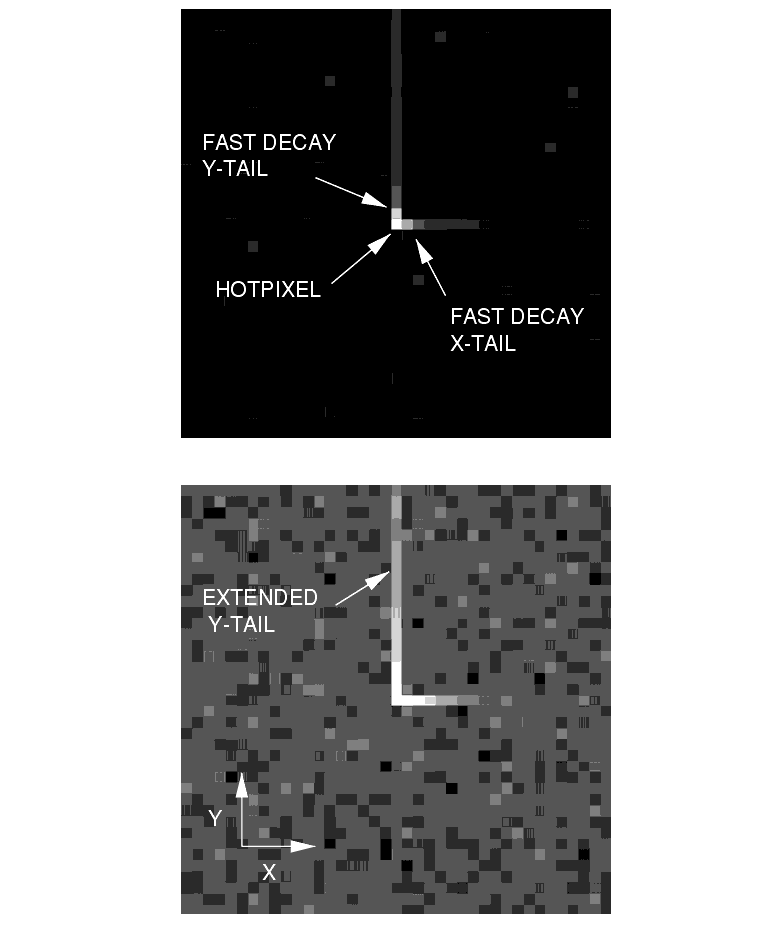
Figure 4.16: Intensity profile of CTE tail in Y direction for averaged hot pixel (~350 DN) in 1994 and 1999.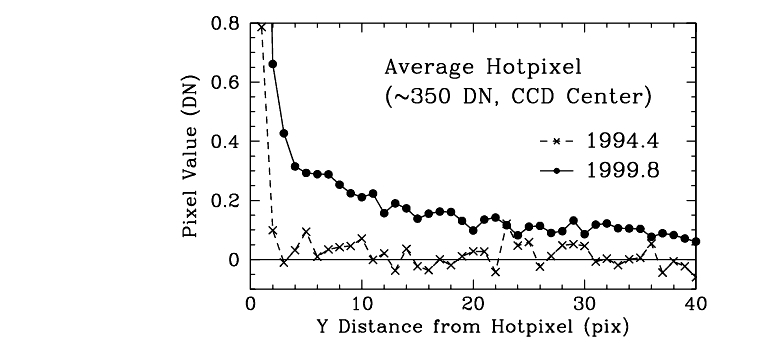
Figure 4.17: Dependence of Y-CTE tail on pixel intensity measured on late 1999 data.
Figure 4.18: Cosmic ray tails in a single WFPC2 dark frame. Each individual point represents one cosmic ray and shows the differences between pixels which are equal distances from a cosmic ray pixel. The line is the median of the data. At low Y there are few charge transfers and hence minimal trailing of charge. At high Y the statistical cosmic ray tails are evident.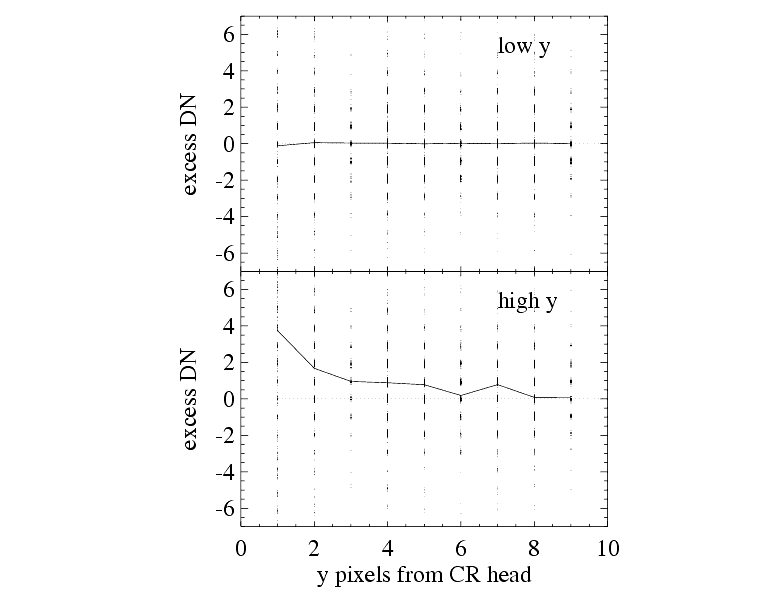
Figure 4.19: Counts in CTE tails measured on cosmic rays. Separate distributions are shown for the X-CTE and Y-CTE.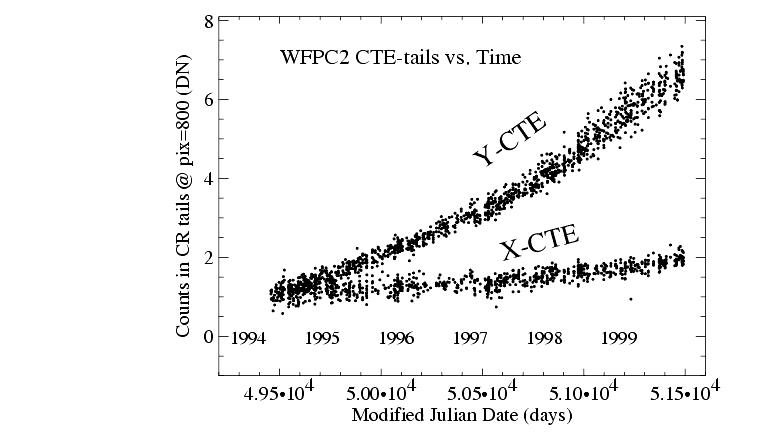
Figure 4.20: Images Illustrating CTE Residual Trail. (a) Image of star field taken in broad band filter on PC1. (b) 1500s dark exposure taken immediately following (a). Read out direction is towards bottom of image. Cosmic rays have been removed.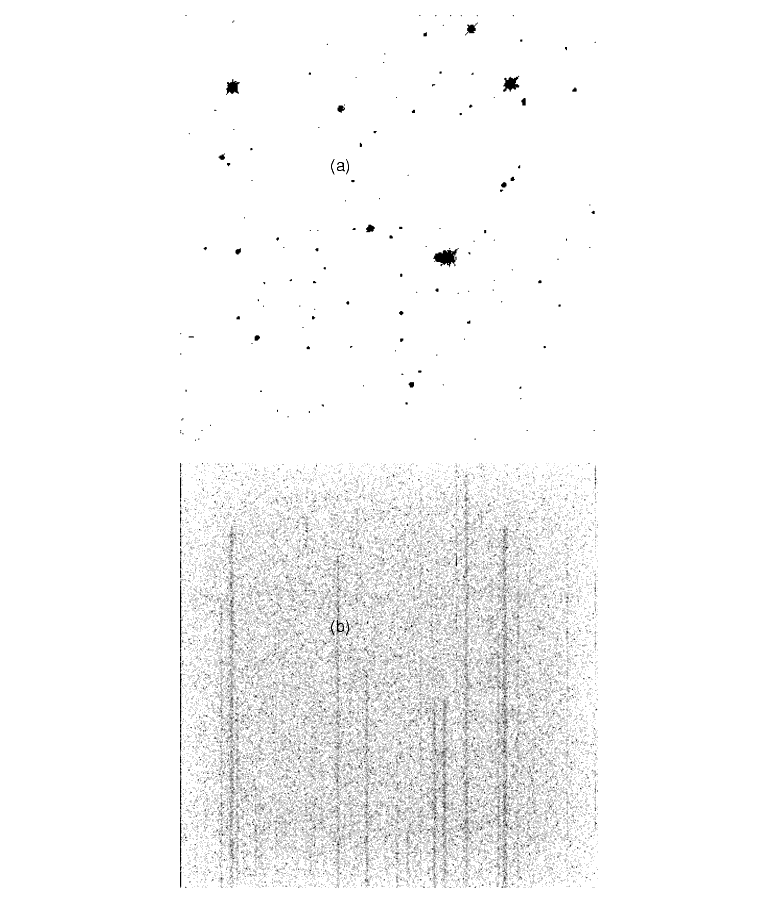
Mitigating CTE during observations
Observers can use a number of strategies to minimize the effect of CTE loss. Longer individual exposures help by increasing both background and source counts, both of which reduce CTE loss. Users thinking of dithering may wish to take this into account if they are considering shortened exposures to allow for more dither positions.
When observing a target significantly smaller than a single detector, it is advisable to place it towards the bottom of a chip. For example, the aperture WFALL will place the target near the bottom of Chip 3. (Note however that targets larger than about 20" centered on WFALL will be split between chips, which itself may lead to photometric problems.) The resulting data can still be corrected using the CTE correction formulae, and the corrections will be smaller.
When the very highest possible accuracy is required, another possibility is to include a special calibration observation of
A further possible strategy is to preflash the chip to raise the background level. However, tests indicate that the required level of preflash is so high that in general more is lost than gained by this method. A variation of this is currently being tested in the "noiseless" preflash proposal (8450), where a flat field exposure is read out immediately prior to a short science exposure.1
As part of the Cycle 8 and 9 Calibration Plans, we will continue monitoring the CTE for point sources by repeating the key observations of
The Long vs. Short Photometric Anomaly
The so-called "long vs. short" anomaly is a nonlinearity of WFPC2 which causes the recorded count rate to increase with exposure time for a given source - the source thus appears brighter in a long exposure than in a short exposure. A recently completed study of this anomaly (Casertano and Mutchler 1998) shows that it is primarily a function of the total source counts, and, unlike the CTE anomaly, is independent of the position in the chip. In the simplest interpretation, a fraction of the total counts are lost, with the fraction decreasing as the source counts increase. The fraction lost is about 3% for a source with 300 counts, and rises to over 20% at 40 counts. Sources over 1000 counts are not measurably affected. There appears to be a weak dependence on background, in the sense that the loss of signal is slightly lower in high-background images, but this effect is not significant in terms of the overall characterization of the correction.
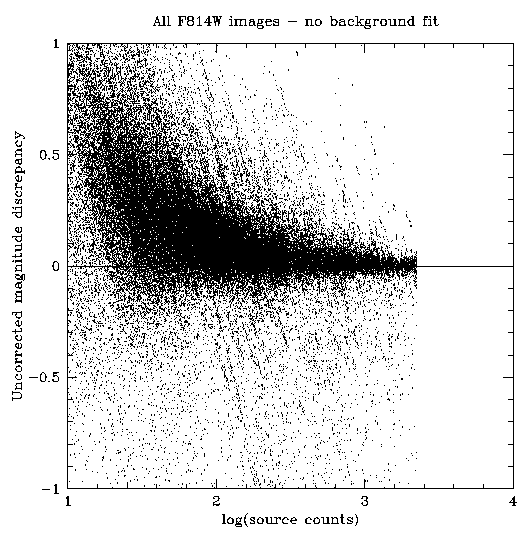
Figure 4.21: Magnitude discrepancy for exposure times from 10s to 1000s in F814W, plotted against total measured counts. Some exposures have been preflashed with 5 to 1000 e/pixel. The major trend is against total counts.
Click the image above to view full-size
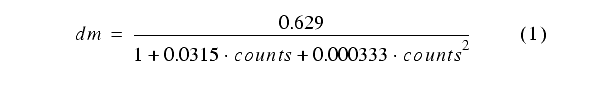
We have developed a simple correction formula that can be used to compensate approximately for the signal lost. The formula expresses the magnitude correction dm to be subtracted from the measured magnitude:
as a function of counts, the background-subtracted source counts in a 2-pixel aperture, measured in DN at gain 7. Note that the correction formula is applied after the CTE correction discussed in the previous section has been made.
Figure 4.21 shows the uncorrected magnitude errors for individual F814W observations of a field in NGC 2419 containing stars of various magnitudes, observed with exposure times ranging from 10s to 1000s and various preflash levels. The anomaly is illustrated by the rise in magnitude errors for low source counts. The effect of our correction is shown in Figure 4.22, where the dashed line and error bars plot the median and quartiles of uncorrected magnitude errors, while the solid line indicates the median of the residual magnitude errors, after the correction in Equation (1) is applied. Magnitude errors are corrected quite well, except for very faint sources (< 30 counts).
Figure 4.22: Median and quartiles of the magnitude discrepancy, before and after the correction in Equation (1) has been applied (solid and dashed lines, respectively).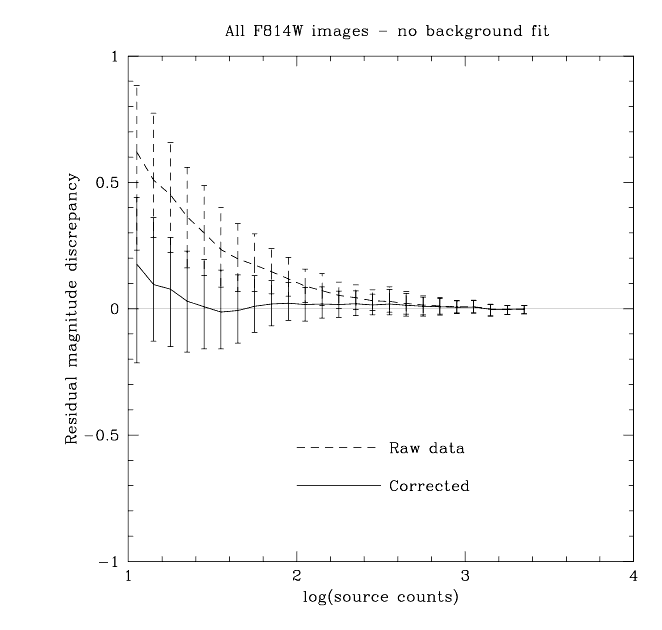
On the basis of the evidence collected so far, the anomaly appears to be more properly a function of total counts in a stellar image, rather than a direct function of exposure time. The commonly used "long vs. short" name is thus somewhat of a misnomer. One possible model suggests that the effect results from non-linearity or hysteresis in the readout amplifier.
It should be emphasized that the correction in Equation (1) has been derived from a specific set of conditions, and may not be valid in general. Specifically, images obtained by combining several subexposures and images taken at gain 15 have not been studied. Casertano and Mutchler (1998) provide some suggestions on how to handle such cases. Further data, including a test of the noiseless preflash, will be taken as part of the Cycle 8 and 9 calibration programs.
1 More details can be found in Biretta and Mutchler (1998) and Whitmore (1998).
|
Space Telescope Science Institute http://www.stsci.edu Voice: (410) 338-1082 help@stsci.edu |