[Top] [Prev] [Next] [Bottom]
32.7 Flatfield Calibration
The structure in the FOS flatfields is dominanted by photocathode granularity. Target location on the photocathode and time changes in the photocathode itself are the dominant source of uncertainty in the FOS flatfields. The flatfields limit the signal-to-noise achievable (in the limit of infinite counting statistics) and the reliability with which line features can be identified. The major factors affecting the accuracy with which the FOS flat field reference files will correct the flatfield granularity in your observations are:
32.7.1 Flatfield Summary
Since photocathode granularity is the dominant component of FOS flatfield structure, factors which affect the illumination of the photocathode dominate the degree to which a calibration flatfield is appropriate for your data. Given the small spatial scale of photocathode variation, the best flatfield correction is obtained only for those targets that were acquired with accuracies comparable to those used in STScI calibration programs. Secondly, given the temporal variation present in some spectral regions, the accuracy of flatfield correction is also affected by the ability of flatfield calibration observations to track the variation.
The overall flatfield correction generally has an accuracy of better than 3%. Features in certain specific dispersers, apertures, spectral regions, and times of observation can be somewhat poorer as changes may not have been adequately tracked by calibration observations. Limiting accuracy of order 1% is possible for observations taken close to flatfield calibration observations and for which nearly exact alignment of photocathode granularity is accomplished (see Figure 32.23 as an example of some of the best flatfield correction possible with the FOS).
High-precision (S/N > 30) spectroscopic measurements with the FOS required that the observations sample the same portion of the photocathode as did the flatfield calibration observations. This sampling repeatability was limited by the target acquisition accuracy (for calibration and high S/N observations, typically 0.04" which corresponds to 0.025" in each coordinate) and filter-grating wheel positional repeatability (approximate 1 deviation of 0.04"). The photocathode granularity could vary by 5 to 10% over distances as small as 0.2". Small x-offsets, typically 1 pixel or less, could occur in the granularity pattern from one observing epoch to another. Paired aperture granularity was substantially different from that for the single apertures.
Post-COSTAR extended source flatfielding can be improved by using the last epoch of pre-COSTAR flatfields for the detector-disperser combination, due to the more extended nature of the pre-COSTAR PSF.
For a limited subset of gratings, mapping of the post-COSTAR granularity in the direction perpendicular to dispersion is available at one epoch which you can examine by reference to the special set of drift-scan FOS calibration observations made in calibration program 6916 (December 1996 and January 1997).
Working with Flatfields
You should be particularly wary of unusual features in your data. In order to assess the impact of the flatfield used in the data reduction process for any particular FOS observation, and as a careful check:
32.7.2 Flatfield Details
FOS flatfields are prepared from precisely pointed (£0.025" pointing accuracy in each coordinate), high S/N observations (S/N  200 per pixel, typically) of two relatively featureless spectrophotometric standard stars, BD+28D4211 and G191B2B (also known as WD0501+527). All FOS flatfield reference files are actually unity-normalized inverse flatfields, that are applied as multiplicative operators in calfos data reduction to correct for small-scale (less than 10 diode width) differences in the sensitivity. These pixel-to-pixel sensitivity variations resulted mainly from small-scale inhomogeneities in the photocathode (the so-called granularity). A much less important contributing factor was diode-to-diode variation in sensitivity, as this effect was greatly diminished by the OVERSCAN data-taking process which caused each output pixel to contain contributions from five different diodes.
If the appropriate observational strategies were employed, the overall flatfield correction generally has an accuracy of better than 2-3%. However, flatfielding for certain specific dispersers, apertures, spectral regions, and epochs of observation can be somewhat poorer. For example, substantial (5 to 10%) flatfield variation did occur on spatial size-scales as small as 0.2" for several detector and disperser combinations, so that precise flatfield correction is only possible for science targets acquired with the same high pointing accuracy used for calibration observations. The standard recommendation of the FOS team was that any program requiring S/N >30 should use the same target acquisition accuracy used in the STScI calibration observations.
So-called superflats and superflat-derived flats produced by comparison of raw data with superspectra (highly accurate countrate distributions from the FOS gratings obtained via a cross-correlation technique)2 provide the best quality flatfields. Some SV epoch flats and all polarimetry flats were produced with a more subjective, much less accurate technique that involved normalizing a standard star spectrum with a continuum spline fit (see FOS ISR 075). These subjective flats often did not completely remove larger features and features with high local rates-of-change due to the uncertainty in the continuum normalization process required for their preparation.
Time Dependence
The FOS/RD G190H, G160L, and, to a lesser extent, G270H flatfields displayed marked time dependence throughout both the pre- and post-COSTAR periods. Several other gratings (e.g., FOS/RD G400H, G570H, and FOS/BL G130H, G160L displayed varying degrees of generally more modest temporal change. Figure 32.19 illustrates the striking changes in the FOS/RD G190H flatfield that took place within the first two years of operation. The strong feature at approximately 1950 Å. continued until mid-1995 when it began to disappear. By the end of the FOS lifetime, the granularity at that wavelength had returned to near launch levels.
Figure 32.19: FOS/RD G190H Flatfield Changes
Aperture Dependence
All pre-COSTAR flatfields are somewhat aperture dependent as the PSF filled many of the apertures. However, individual aperture-specific flatfield observations were not made for many apertures in the pre-COSTAR period. Little post-COSTAR aperture dependence existed between the single apertures or between the paired apertures for a particular disperser, but substantial differences did exist between single and paired apertures for any disperser because substantially different portions of the photocathode were sampled by the centers of the different aperture sets. Due to these substantial photocathode granularity spatial variations, flatfield reference files derived from single aperture observations should never be used to correct paired aperture observations and vice versa.
Figures 32.20 and 32.21 provide a characterization of the overall photocathode granularity corrections by showing, at low-scale, representative SINGLE aperture flatfields for high dispersion gratings for both FOS detectors.
Figure 32.20: Typical SINGLE Aperture Flatfield Granularity: FOS/BL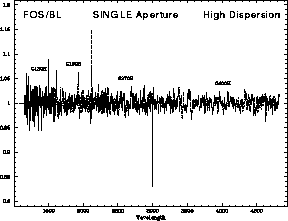
Figure 32.21: Typical SINGLE Aperture Flatfield Granularity: FOS/RD
Granularity Shifts Along Dispersion
Small x-shifts of the observed granularity did occur relative to the positions at the standard star epochs due to slight changes from time-to-time in the internal magnetic environment of the detectors. This observed effect was typically +/- 1 pixel or less, with one documented 2 pixel shift. As a result, shifting your observed spectrum relative to the flatfield prior to re-calibration can occasionally improve the granularity correction. Tests performed with standard star data have indicated, however, that small-scale, even sub-pixel, offsets between identical observations can introduce pattern noise at the 1% level. As a result, 1% rms is deemed the practical limit with post-COSTAR superflat-based flatfields, good aperture centering, and precise x-coordinate alignment.
FOS flats are not interpolated between standard star observation epochs. They are each prepared from an individual high S/N observation of a standard star and typically applied over a time-range that is inclusive of the date of standard star observation. As a result, you might be able to improve the flatfielding at a particular epoch by interpolating between two flatfield reference files, but the x-shift pattern noise considerations mentioned above may limit the benefit of this procedure.
Granularity Perpendicular to Dispersion
For a limited subset of gratings, mapping of the post-COSTAR granularity in the direction perpendicular to dispersion is available at one epoch which you can examine by reference to the special set of drift-scan FOS calibration observations made in calibration program 6916 (December 1996 and January 1997). These observations, taken in RAPID mode, sampled the entire height of either the 4.3 or 1.0 aperture at approximate 0.1" intervals (see proposal for details) for several commonly-used gratings. Comparison of the individual readouts allows characterization of the flatfield rate-of-change perpendicular to dispersion. Additionally, the influence of target miscentering (and Y-base misalignment) on wavelength-dependent aperture throughput can be evaluated from these data.
Application of Inappropriate Flatfield
If an incorrect, or inappropriate, flatfield reference file is used to flatfield the data, small emission-like or absorption-like features will appear in the spectrum corresponding to sensitivity variations that were introduced or left uncorrected by the flatfielding. Depending upon the scale of the shift or mismatch, these artifacts can be range from as little as 1-2% up to >20% in size.
Figure 32.22 shows an example of a spectrum that was flatfielded incorrectly. Panel (a) shows the count rate data in the .c5h file that results from using both correct (solid line) and incorrect (dotted line) flatfield files. Panel (b) shows a blowup of the region from pixels 300 to 1300 of the same data.
Figure 32.22: Incorrectly Flat-Fielded Spectrum of the Red G190H Grating
Flatfield Generation Rules
The following general recommendations summarize the guidelines that have been used for the applicability of FOS flatfield reference files and in generating the FOS flatfield reference file set from the various calibration observation datasets. They are provided as a guide for those interested in comparing their observations with other flats and with standard star observations other than those used for the generation of the flats.
Pre-COSTAR
FOS/BL:
FOS/RD:
- For the G190H, G270H, and G160L dispersers, the Cycle 3 superflats of Lindler et al.3 should be used for all observations obtained after August 7, 1993.
- For G400H, G570H, G650L, and the PRISM, the Cycle 3 superflats of Lindler et al. should be used for all observations obtained after June 18, 1992.
- For all other FOS/RD observations with the above dispersers, the FOS/RD flatfield obtained closest to the observation date should be used.
- No SINGLE aperture flats should be used to correct data obtained with a paired aperture.
- For G780H, no pre-COSTAR flatfields exist-unity correction is applied in the pipeline. Alternative is to smooth post-COSTAR flats.
- For all barred apertures, no pre-COSTAR flatfields exist -unity correction is applied in the pipeline.
Post-COSTAR:
- Due to the offset in aperture location between 4.3 and other SINGLE apertures and 1.0-PAIR and other paired apertures, 4.3 aperture flats are always used only for 4.3 aperture observations and 1.0-PAIR aperture flats are always used only for 1.0-PAIR aperture observations.
- UPPER paired aperture flats are always used for UPPER paired aperture observations and LOWER paired aperture flats are always used for LOWER paired aperture observations. Only one speoch of LOWER aperture flats exists in most cases.
- 0.3 aperture flats are used for 0.5, 0.3, and SLIT aperture observations.
- 0.25-PAIR aperture flats are used for 0.5-PAIR, 0.25-PAIR, and 0.1-PAIR, aperture observations, except for FOS/RD G570H 0.1-PAIR for which 0.1-PAIR-derived flats are used.
- Following the above rules, Each observation of BD+28D4211 or G191B2B with a particular aperture defined a new flatfield reference file to be used until the next observation epoch of one of those targets.
- For all barred apertures, no post-COSTAR flatfields exist - unity correction is applied in the pipeline. Drift-scan observations could be used as a guide.
- As for pre-COSTAR data, no SINGLE aperture flats should ever be used to correct data obtained with a paired aperture.
Characterization of Flatfields for Individual Gratings
Pre-COSTAR flatfields were generally smoothed with a 3-point boxcar smoothing function. Post-COSTAR flats were not smoothed. As a general rule, features in post-COSTAR flatfields were narrower than their pre-COSTAR counterparts by an amount greater than the influence of the smoothing function.
The descriptions of various flatfields that follow are generally restricted to the SINGLE apertures unless otherwise indicated:
FOS/BL:
FOS/RD:
- G190H: These flats showed significant wavelength structure (Figure 32.19) and they displayed strong (>10%) wavelength-dependent temporal variations during the first year of HST operation when flatfields were not routinely monitored. The most obvious features were at approximately 1950 and 2050 Å. Between January 1992 and June 1992, the G190H, G160L, and G270H FOS/RD flatfields were monitored monthly. During this intensive monitoring period none of these flats varied by more than 2%. For the duration of the pre-COSTAR period, and indeed post-servicing, these flats were monitored regularly though less frequently. Several substantial (5%) new features appeared in the G190H region between June and November 1992. For the remainder of the pre-COSTAR era (ending December 1993) changes were less than 2%. Post-COSTAR time-variation of FOS/RD G190H flatfields was also observed. Between November 1994 and February 1995, 2 to 4% changes occurred in the same spectral regions that were active in the pre-COSTAR era. By June 1995 the strong feature at 1950 Å. diminished by a factor of two, although it was still present at the 10% level. By September 1996 this feature had essentially vanished.
- G270H: This region showed flatfield changes in the pre-COSTAR period as did FOS/RD G190H, but the variations and sizes of the features were much smaller. This region was monitored at the same rate as G190H and displayed little additional variation in the pre-COSTAR period. A variety of features continued to exist at the 5-15% level in the post-COSTAR period and only a few 2-3% variations occurred.
- G400H: Generally well-behaved in the pre-COSTAR era, this spectral region began to display substantial changes between standard star observations made in July 1994 and June 1995. Of particular note is a variable SINGLE aperture feature in the vicinity of 4475 Å that affects the He I
 4471 line seen in many hot objects. Throughout this region there are a number of 10% features, several of which fall in the vicinity of the hydrogen lines.
- G570: Several strong and, in the post-COSTAR case, sharp features were present in this region. No strong variability has been noted for the granularity in this region.
- G780: Only post-COSTAR flats exist. The S/N of the standard stars was somewhat poorer in this spectral region, so the quality of these flats longward of 7500 Å. is quite poor.
- G160L: This region showed flatfield changes in the pre-COSTAR period as did FOS/RD G190H, though the variations and sizes of the features were not as large. This region was monitored at the same rate as G190H and displayed little additional variation in the pre-COSTAR period. A variety of features continued to exist at the 5-15% level in the post-COSTAR period and only a few 2-3% variations occurred.
- G650L: Typically 5-10% features are seen. Little variation was detected.
- PRISM: Due to the rapidly changing wavelength scale and the difficulty of aligning standard star spectra with template superspectra, the quality of PRISM flatfields is limited. Careful alignment of the flatfield with target spectrum is required.
Figure 32.23: Raw and Flatfield-Corrected FOS/RD G270H
Figure 32.24: Photocathode Blemish at 1500-1560 Å
[Top] [Prev] [Next] [Bottom]
1
Detailed information about flatfields is provided in FOS ISRs 075, 078, 088, 134, 143, and 157.
2
The superflat observational and analysis procedures are explained in detail in FOS ISRs 088, 134, and 157.
3
FOS ISR 134.
stevens@stsci.edu
Copyright © 1997, Association of Universities for Research in Astronomy. All rights
reserved.
Last updated: 01/14/98 14:55:10