


The linearity performance also depends on the image structure. If the illumination is nearly uniform, then the non-linearity depends on the frame scan time and the photon event size (typically 3 3 pixels). However, if the illumination comes from a perfect point source, then the photon event size does not matter, since there are no neighboring photon events, only those that arrive in the illuminated pixel. For FOC images, no source is truly pointlike, but the linearity characteristics of astronomical point sources and flat fields are sufficiently different that they are discussed separately. The situation for more complex image structure (i.e., just resolved or linear) will of course be intermediate between these two limiting cases.
where z = 1 for normal and z = 2 for zoomed pixels. For the most widely-used format (512 512, normal pixels), this comes to 30 milliseconds. If, during a frame, more than half of the format area is occupied by photon events, a further event will overlap one or more existing events and will not be counted as a detected photon. This would predict a maximum count rate for the 512 512 format of 0.05 counts/pixel in 30 milliseconds, or about 1.7 counts/sec/pixel. In practice the saturation level is reached at a lower level, because most of the overlapping events are much larger than a single photon event and are classified as ion events and rejected.
Uniform Illumination
Here "uniform illumination" refers to the case where the intensity varies by less than 20% over scales of 20 pixels. The frame scan time is given by:Table 6.2: Calculated Flat-Field Linearity Parameters
The flatfield nonlinearity was measured on-orbit during OV and SV using observations of the internal LED calibration lamps. It was found that the intensity of the light from these lamps is directly proportional to the commanded intensity level. The linearity curve was measured for several different formats to verify the format dependence of the saturation, and the dependence on zoom mode was also investigated. A plot of the measured linearity relation for the 512 512 formats of the pre-COSTAR F/96 and pre-COSTAR F/48 detectors is shown in Figures a and 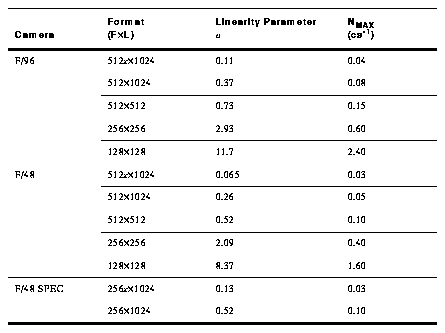
where r is the measured count rate, r is the "true" count rate and a is a fitting parameter that is identified as the asymptotic measured count rate.
When the FOC is configured for zoomed pixels, the linearity performance is slightly different from what would be expected from scaling the results for normal pixels by the ratio of frame scan times. This is because the event sizes and the VPU detector logic are different for zoomed pixels. However, once the linearity performance of one format is calibrated for each camera in zoom mode, the performance at other formats in zoom mode can be derived by scaling by the ratio of format areas, as is the case for normal pixels. The validity of the scaling assumption for both normal and zoomed pixels was checked and found to be true.
Values of a for the most commonly-used formats are given in Table 6.2. The values refer to dezoomed data in the case of formats that were originally zoomed. In practice, the value of a depends somewhat on position in the image, since it is effectively a measure of the photon event size, and this varies over the format due to slight focus quality variations. To ensure that non-linearity does not compromise the science data, users are advised to ensure that the count rate is kept below NMAX, which is the count rate that would give 10% nonlinearity, as given in the third column of Table 6.2. Correct and quantifiable operation of the FOC at count rates exceeding NMAX cannot be guaranteed.
During OV and SV it became clear that for the FOC pre-COSTAR F/96 camera when used in the 512 512 format, the maximum obtainable count rate in the core of a star was approximately 3 counts/second/pixel. Variations on this level occur because of jitter, focus, etc. At count levels higher than this, the core of the star turns into a dark `hole', and a bright crescent appears to one side of the core. Comparison of PSF's taken with and without neutral density filters indicate that there is no noticeable deviation from linear behavior for core count rates up to 1 count/sec in the brightest pixel. This produces the simple guideline for observers: keep the count rate in the central pixel below 1 count/sec, and then any photometry method chosen will give results that are not biased by non-linearity effects. If the central count rate is above 1 count/sec, one will need to use other methods to determine the brightness of the star (such as measuring the intensity in the bright halo).
An example of the non-linearity relation for point sources is shown in Figure Figure 6.5: Flat-Field Linearity Plots for the Detectors in the Pre-COSTAR F/48 and Pre-COSTAR F/96 Relays, a and b Respectively, Based on 512 x 512 Pixel Flat-Field Images of the Internal LEDs at Different Intensities. The solid line in each plot is the best-fit solution for the linearity function given in the text.
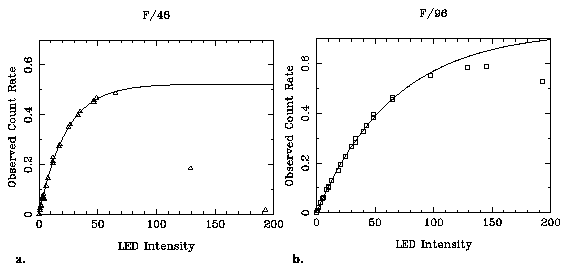
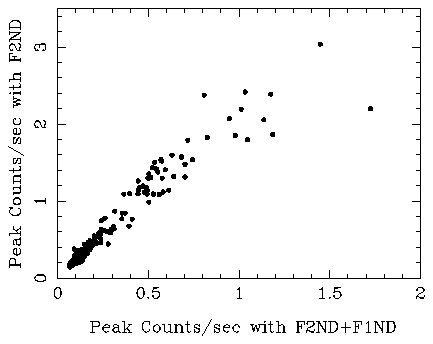
Figure 6.6: Linearity Relation for Point Sources Based on 512 x512 Pixel Images Taken with the Pre-COSTAR F/96 Relay Through the F342W Filter.
Non-Uniform Illumination
When the illumination comes from a star, the FOC is able to count at a much higher rate before saturation occurs. This is because photon events centered on pixels close to the central pixel of a star are much less probable than in the flatfield case. However, because it is difficult and time-consuming to obtain stellar images at a large number of intensity levels, it was not possible to calibrate the point-source non-linearity relation for the pre-COSTAR PSF to the same accuracy as could be achieved in the flatfield case. The dependence of the core structure of the PSF on such factors as secondary mirror position, jitter and wavelength also made such an investigation impractical.
To put some hard numbers around these figures, note that a 20th magnitude A0V star will give a total count rate with the F342W filter of 10.9 counts/sec. Referring to Table , one can see that for the F/96 relay, the central pixel contains ~8.7% of the total light, therefore the expected count rate for this star is 0.95 counts/sec in the central pixel, which is at the FOC linearity limit. To observe stars brighter than 20th magnitude, it is necessary to either use a smaller format, neutral density filters or a narrower filter (e.g., F346M).
Recent attempts to deal with non-linearity corrections for pre-COSTAR FOC data are presented in FOC Instrument Science Reports FOC-073 and FOC-074, which are available from STScI or can be browsed from the FOC WWW pages.
Generated with CERN WebMaker