|
| NICMOS Instrument Handbook for Cycle 11 | |||
|
|
Detector Artifacts
Shading
The NICMOS arrays exhibit a noiseless signal gradient orthogonal to the direction of primary clocking, which is commonly referred to as shading. It is caused by changes of the pixel bias levels as a function of temperature and time since the last readout ("delta-time"). The amplitude of the shading can be as large as several hundred electrons for some pixels under some circumstances. The first pixels to be read show the largest bias changes, with the overall shading pattern decreasing roughly exponentially with row number. The shading is a noiseless contribution to the overall signal, therefore it can be completely removed during pipeline processing once it has been calibrated with delta-time and temperature.
For a given delta-time, the bias level introduced by the shading remains constant. For
MULTIACCUMreadout sequences (see Chapter 9) where the time between readouts is increasing logarithmically, the bias level changes with each successive read, and thus the overall shading pattern evolves along theMULTIACCUMsequence. We have calibrated the dependence of shading as a function of delta-time for each of the three NICMOS detectors using Cycle 7 darks, and are now able to use this information to construct "synthetic" dark current calibration reference files for NICMOS observations. The accuracy of this calibration is good (a few percent for most readout times).The warm-up monitoring program provided an opportunity to measure the temperature dependence of the shading signal. Figure 7.12 shows how the shading profile of NIC2 varied with increasing detector temperature, and how this change can be effectively modeled for calibration.
Figure 7.12: Top: temperature dependence of the shading profile in camera 2. Shown are cuts along the line direction for all dark exposures throughout the warm-up, with the lowest curves corresponding to the lowest temperatures. Bottom: mean shading signal over columns 145 to 155 (indicated by the grey arrow) as a function of detector temperature.: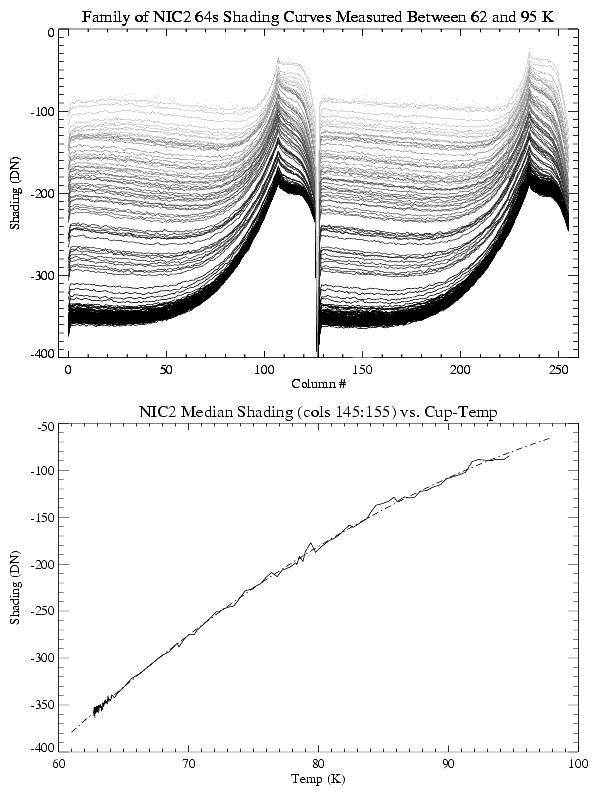
Amplifier Glow
Each quadrant of a NICMOS detector has its own readout amplifier situated close to the corners of the detector. Each time the detector is read out, the amplifier warms up and emits infrared radiation that is detected by the chip. This signal, known as amplifier glow, is largest in the array corners with ~ 80 e-/read, and falls rapidly towards the center of the detector where it is about 10 e-/read. The signal is cumulative with each non-destructive readout of an exposure. It is highly repeatable, and is exactly linearly dependent on number of reads. It also is constant with temperature, as shown in Figure 7.13.
Figure 7.13: Amplifier glow signal as a function of detector temperature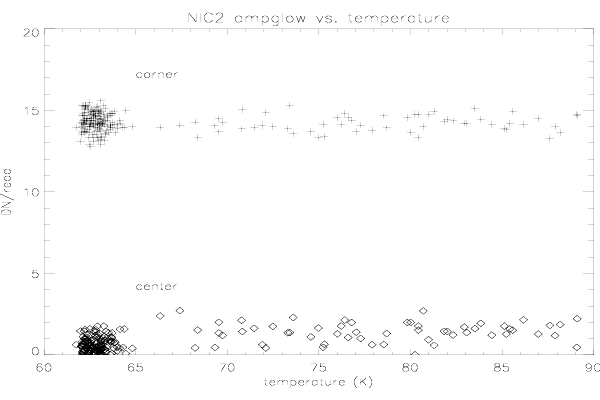
In contrast to the shading, the amplifier glow is a photon signal, and thus is subject to Poisson statistics. It therefore contributes to the total noise in NICMOS exposures. Amp-glow images for all three cameras are shown in Figure 7.14. For the case of an
Figure 7.14: Amplifier glow for Cameras 1 (left) through 3 (right), on a uniform grayscale, and below a plot of rows (near the bottom) of each camera.ACCUMexposure with multiple initial and final reads (see Chapter 9), the photon noise produced by amplifier glow can outweigh the read noise reduction from the multiple reads, especially close to the array corners producing a total noise reduction never larger than ~ 40 - 50%. Similarly, the trade-off between improved cosmic ray rejection, reduced read noise, and increased photon noise in aMULTIACCUMsequence is complicated.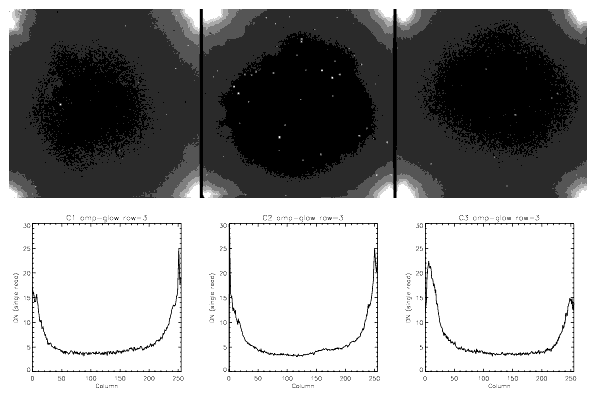
Overexposure of NICMOS Detectors
Effects of photon and cosmic-ray persistence are described in Chapter 4.
Electronic bars and bands
Electronic "bars" are an anomaly in NICMOS data taken during Cycles 7 and 7N. They appear as narrow stripes that cross the quadrants of an array, and occur identically in all 4 quadrants at the same rows/columns in each. The bars are caused by pick-up of an amplifier signal on one of the row/column address lines, causing a momentary change in the bias for that pixel.
Similarly, electronic bands are caused when one of the NICMOS detectors is reset while another is being read out. The reset pulse causes a sudden jump in the bias of the detector which is being read. The bias jump then appears as an imprint on the image that looks like a band.
The bars typically run the length of a quadrant (128 pixels), and are 3 pixels wide - the first pixel is lower than the mean, the second is at the mean level and the third is higher than the mean, giving the impression of an undersampled sinusoidal spike with an amplitude of up to ~10 DN peak-to-peak. If a bar appears in the 0th readout, it will be subtracted from all the other readouts as part of the normal calibration process, and will appear to be the negative of the above description. The bars are almost always broken in at least one place, with a shift of 2-10 pixels in the narrow direction. These sometimes correspond loosely with the breaks in the "bias jump" bands in the last readout of a
MULTIACCUMsequence, indicating they may be related to the same electronic phenomenon.The bars run parallel to the slow readout direction, which is vertical in NIC1, and horizontal in NIC2 and NIC3. Normally there is only one bar per quadrant, but occasionally there are more, always reflected in all 4 quadrants. Sometimes the bars will be "in sync" and appear at the same place in successive or every other readout, or may appear to march across the frame over the course of a
MULTIACCUMsequence. A more detailed description of the electronic bars and bands is given on the NICMOS WWW site:
http://www.stsci.edu/cgi-bin/nicmos
Bad Pixels
Hot pixels are pixels with excessive charge compared to the surrounding pixels, while cold pixels are less sensitive than the surrounding pixels or have no sensitivity. Many of these pixels were identified during the Thermal Vacuum testing performed on the ground in August 1996. Statistics of the hot/cold pixels in the three NICMOS cameras is given in Table 7.2. The best way to minimize the effect of hot or cold pixels is to dither the observations
Table 7.2: Hot and Cold Pixels in NICMOS
"Grot"
Flat fields taken on orbit revealed a new population of pixels with very low count rates. It is believed that the bad pixels are caused by debris lying on top of the detectors. Paint flakes from the optical baffles are one possible source of this debris. The largest of these areas of bad pixels occurs in NIC1 and is shown in Figure 7.15 below. Approximately 100 - 200 pixels in each of NIC1, NIC2 and NIC3 are affected by this debris. Dithering is recommended for observers who believe that these and other pixel defects could adversely affect their science goals. We expect the "grot" to still be present in Cycle 11 as it was in Cycle 7 and 7N.
Figure 7.15: A portion of a NIC1 flat field image shows the largest of the groups of pixels affected by debris ("grot"). This bit of "grot" is roughly 5 by 9 pixels and is located in the upper left quadrant of NIC1.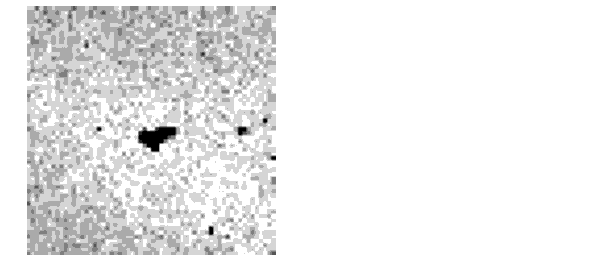
|
Space Telescope Science Institute http://www.stsci.edu Voice: (410) 338-1082 help@stsci.edu |