


Imaging
Say that you are interested in observing an unreddened A0V star of mu=24 with an accuracy of 10% using the F342W filter, and the F/96 relay with normal sized (unzoomed) pixels for which z=1. From Table 3 for the F346M filter, you find that l0=3480Å, Dl=434Å, QT(l0) =0.039. The stellar flux F(l0) = 8.0 102 10-0.4 24 = 2.0 10-7 photons cm-2sec-1Å-1. Inserting these values into eq. (4), you get RS=0.15 e(l0) counts sec-1. This is the total count rate from that star spread out over a certain number of pixels corresponding to the e(l0) chosen from Table 8. If the star is reddened by a given total extinction AV, you should use a standard or average reddening curve (see Savage and Mathis, Ann.Rev. Astr. Ap., 17, 73, 1979 for an example) to deduce the appropriate Al0. Then, RS can be multiplied by  to take this effect into account in the simplest possible way. The possible inaccuracies introduced by this method are probably not worse than the uncertainties on the validity of the reddening curve itself and/or the prediction of the continuous flux to be observed.
Next, calculate RB from eq. (5) using the data in Figures 7.1 and 7.2. Far ultraviolet airglow is not going to be a factor in the B bandpass. The zodiacal light background per pixel can be estimated by means of the data graphed in Figure 7.2 and Table 7.1. Suppose the star is viewed at b=15xfb and l-lO.=120xfb for which S=120 S10 units, and from Figure 7.2, we find IB(3480Å) of ~120 for an intensity of 1 S10. Then, the zodiacal light contribution is
so that, assuming Bp= 710-4 counts sec-1 per normal pixel, eq. (5) can be written as:
Then, the required exposure time can be easily computed from eq. (1) and the data in Table 8 for e(lo). Using the data in the column marked F346M, one obtains:
The accuracy of this approximation is, of course, a sensitive function of the shape of the instrument bandpass and is, therefore, expected to be highest for the narrow, well-defined passband filters with negligible red and/or blue leaks. It will certainly only give rough order of magnitude estimates for the wide band pass filters for which a numerical integration of eq. (2)Table 7.2: Calculated Results
Thus, integrating under the PSF out to a radius of 0.037 arcseconds at n = 21 provides enough flux for the required S/N to be achieved in a minimum exposure time of 1772 seconds. If the background rate for some reason had been 5 times higher, the minimum exposure time would have been 3461 seconds at n = 9.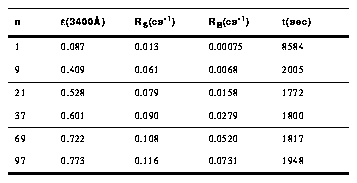
Particular attention has to be paid, in any case, to the expected count rate since it may violate the assumption that 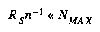 (see Table 6.2 and "Non-Uniform Illumination" on page 69). If it does for the particular format chosen as indicated in Table 6, either the format must be changed or a neutral density filter inserted in order to drop the expected rate below the threshold. This, of course, will also result in an increase in the exposure time required to reach the required S/N ratio.
Spectroscopy
Similar computations can be carried out for a point source in the slit of the spectrograph for the F/48 relay except that, of course, the long slit spectrograph efficiencies plotted in Figure 6.6 have to be used in equations (4) and (5). The bandpass Dl is now naturally limited by the projected slit width of 0.06 arcseconds corresponding to 4, 2, 1.3 and 1Å for first, second, third and fourth order, respectively. The transmission of the order sorting filter also has to be taken into account with special attention devoted to possible higher order confusion if the filter has an appreciable near UV and visible leak and the source has appreciable emission in these regions. This confusion can be eliminated completely for point or pseudo point objects with the use of the objective prism FOPCD as the cross disperser. In this case, the transmission and the dispersion of the prism given in Table 4.3 have to be factored into the calculations.
For the case of the objective prisms, eq. (4) can be rewritten in the form:
where Top is the transmission of the prism tabulated in Table 4.11 and dl is the wavelength interval in Å corresponding to the FOC spatial resolution. This interval can be expressed simply as:
where D(l) is the prism dispersion in Å mm-1 tabulated in Table 4.3, r(l) is the radius of the circle enclosing the required energy e(l) in arcseconds given in Table 6.1 and PS is the plate scale of the appropriate relay in arcseconds mm-1. Then, the source count rate around l is:
Equations (3) and (5) for the noise calculations remain the same except that some simplification can be introduced due to the fact that the overwhelming sources of background in the case T(l) = 1 are the system integrated zodiacal light and the geocoronal Lyman a line. Thus, in this case, eq. (5) can be written as:
where c=0 for the NUVOPs and the FUVOP and FOPCD in the F/48 relay, c=1 for the FUVOPs on the F/96 relay, b=1 for the F/48 relay, and b=2 for the F/96 relay. S is the intensity of the zodiacal light in S10 units and IkR is the intensity of the Lyman a airglow in kilorayleighs.
To see how this works, suppose you want to observe a 20th visual magnitude QSO with a n-2 spectrum and you want to compute the required exposure time to obtain a S/N=10 at 1700Å with the FUVOP of the F/96 relay. In this case, F(1700Å)=10-5 photons cm-2sec-1Å-1. From the data tabulated in Table 6.1, you find r(1700Å)=0.08 arcseconds for e(1700Å) = 0.7 and, from the data in Table 4.3, D(1700Å)=11.72 / 24 10-3 = 488Å mm-1 and Top(1700Å)=0.88 while Q(1700Å)=0.012 from Table 6.3. This means that the source rate from eq. (7) at 1700Å is 0.46 counts sec-1. The count rate is spread over n=97 pixels for z=1 from Table 6.1. Assuming that S = 120 S10 for the zodiacal light, IkR = 5 kilorayleighs, Bp = 7 10-4 counts sec-1 pixel-1, and K=4, c=1, b=2, eq. (8) gives:
Finally, the required exposure time is:
Generated with CERN WebMaker